
TL;DR: AI in accounting education enables university professors to replace 50-slide static PowerPoint presentations with single-file, zero-dependency HTML5 web applications that feature dynamic formula calculators, interactive cost-flow tabs, and real-time self-assessment quizzes. By converting multi-step quantitative procedures—such as equivalent units of production in Process Costing—into interactive exploratory models, faculty eliminate cognitive bottlenecks and align directly with AACSB active-learning standards without writing bespoke JavaScript.
For decades, the standard university lecture in managerial accounting followed an identical script: an instructor stood before a projector advancing through static slides, while students passively copied journal entries, allocation percentages, and ledger balances into notebooks. In complex quantitative modules like Process Cost Accounting, static slide decks fall short. When students must track physical unit flows, compute equivalent units of production under weighted-average and FIFO assumptions, and assemble four-step production cost reports across multiple sequential departments, passive slides obscure the underlying cost mechanisms. Integrating practical AI in accounting education solves this pedagogical bottleneck by turning static slide decks into standalone, responsive web applications with embedded formative assessment engines.
Below: a direct comparison between static slides and interactive HTML5 tools, three live screenshots from JMSB’s COMM 305 curriculum, two interactive application links, and an actionable AI prompt template you can paste into Claude or ChatGPT to generate your own module today.
- Why AI in accounting education replaces static lecture slides with interactive web applications
- Comparing traditional PowerPoint slide decks against interactive HTML5 web applications
- Inside the interactive Process Costing slide deck: dynamic formulas and cost flows
- Real-time formative classroom assessment: deploying the live interactive quiz engine
- Pedagogical frameworks and AACSB standards: why active retrieval outperforms passive lecturing
- Prompt engineering framework: how professors can generate interactive courseware with AI
- Frequently asked questions
- Actionable takeaways and next steps for business faculty
Why AI in accounting education replaces static lecture slides with interactive web applications
Generative artificial intelligence allows business educators to generate clean, browser-ready HTML5 applications containing responsive user interfaces, embedded mathematical components, and instantaneous client-side evaluation scripts from plain-text instructional syllabi. Traditional courseware authoring required dedicated instructional design teams, extensive front-end programming knowledge, or expensive proprietary platform licenses that imposed recurring student subscription fees. With modern large language models, an accounting professor can define pedagogical requirements, paste scenario parameters, and generate an executable, single-file teaching module in minutes.
Quantitative business disciplines require active computational verification rather than passive observation. When students interact with dynamic sliders, reveal sequenced journal entries upon request, and test their comprehension against automated solution engines, retention rates increase markedly. This approach directly operationalizes active learning in managerial accounting, moving classroom delivery from instructor-centered broadcasting to student-centered inquiry.
Core finding: Interactive browser courseware converts abstract cost formulas into verifiable, dynamic simulations that students can explore at their own pace.
Comparing traditional PowerPoint slide decks against interactive HTML5 web applications
Evaluating traditional slide decks against modern HTML5 web presentations reveals substantial differences in engagement depth, typographical fidelity, and deployment flexibility.

Traditional presentation software was engineered for sequential storytelling rather than complex quantitative modeling. In accounting education, forcing comparative frameworks across multiple slides destroys context and fragments student understanding. The table below outlines how single-file web applications address the core limitations of standard slide files:
| Evaluation Dimension | Traditional PowerPoint Slide Deck (.pptx) | AI-Generated Interactive Web Application (.html) | Pedagogical Impact |
|---|---|---|---|
| Student Engagement | Passive listening; linear slide progression controlled solely by instructor. | Active exploration; interactive tabs, live numeric inputs, and modal drill-downs. | Promotes self-paced retrieval practice and tactile problem-solving. |
| Mathematical Layout | Flat text strings, low-resolution pasted equation screenshots, or broken text boxes. | Crisp semantic CSS typography, responsive fraction bars, and structured visual equations. | Maintains visual hierarchy without delimiter corruption or layout shifts. |
| Information Density | Multi-slide fragmentation; 7-row comparative matrices get cut off or become unreadable. | Scrollable card containers with sticky headers; preserves comprehensive context. | Allows side-by-side comparison of costing systems on a single screen view. |
| Platform Dependency | Requires local desktop software licenses (Microsoft Office 365, Apple Keynote). | Zero dependencies; runs natively in any standard web browser on laptops, tablets, or phones. | Eliminates software version mismatches and access barriers for students. |
| Formative Assessment | Static quiz question followed immediately by a static answer slide. | Client-side validation scripts, animated scoring rings, and step-by-step mathematical proofs. | Delivers instant diagnostic feedback during class without external paid clickers. |
Core finding: Standalone HTML5 presentations maintain complete computational autonomy and cross-device compatibility without requiring server hosting or paid vendor plugins.
Inside the interactive Process Costing slide deck: dynamic formulas and cost flows
To inspect how this architecture functions in practice, examine the deployed courseware developed for COMM 305 (Managerial Accounting) at Concordia University’s John Molson School of Business. The application covers Process Cost Accounting and contrasts it systematically against Job-Order Costing systems.
The deployed web application is accessible here: Explore the Process Costing Interactive Presentation Deck.
Departmental cost flows and journal entry tabs
In standard lecture decks, presenting sequential journal entries across Machining and Assembly departments produces cluttered slides with truncated debit and credit alignments. In the interactive HTML5 module, sequenced tab selectors isolate each stage of production: Direct Materials, Factory Labour, Applied Overhead, Inter-Departmental Transfers, and Transfers to Finished Goods.
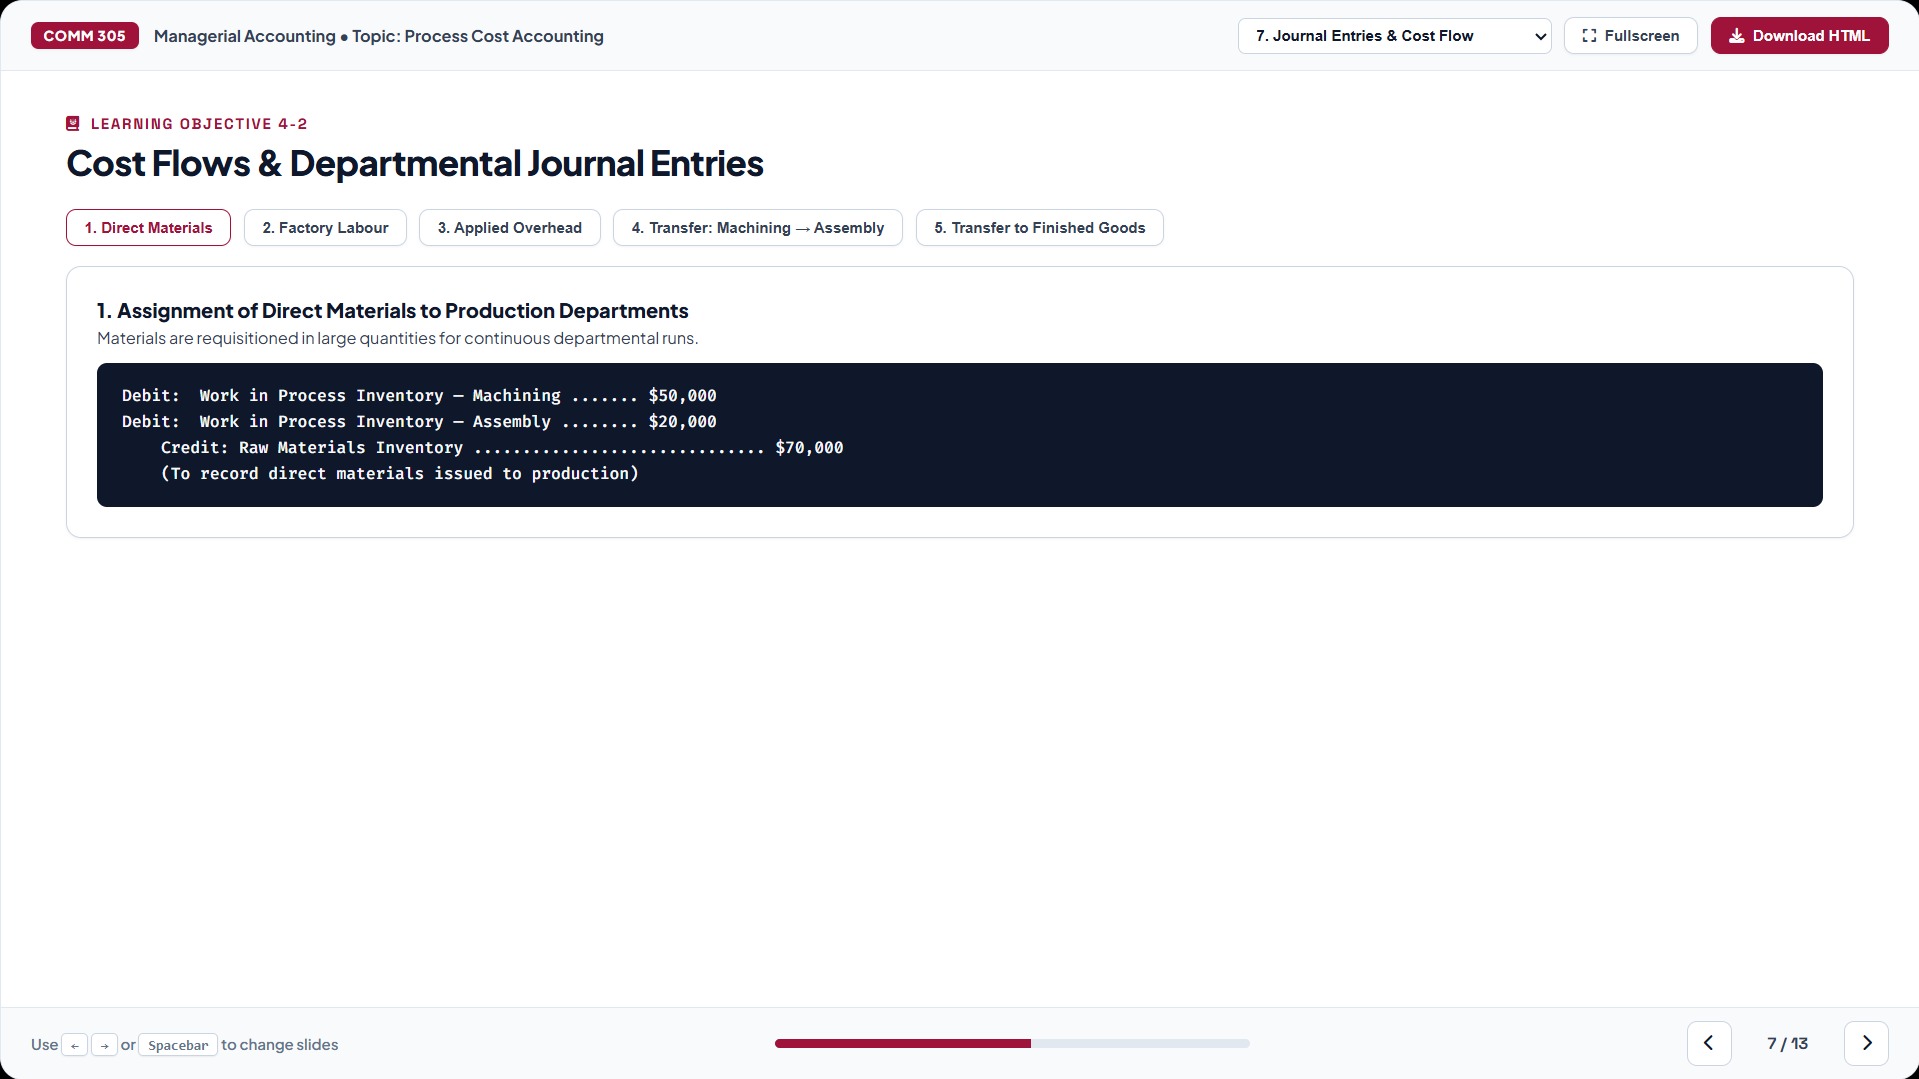
As illustrated in Figure 1, selecting “1. Direct Materials” reveals the exact entry debiting Work in Process Inventory for Machining ($50,000) and Assembly ($20,000) against Raw Materials Inventory ($70,000). Students can click through each subsequent operational stage to observe how manufacturing overhead is applied and how completed units transfer from Machining into Assembly before reaching Finished Goods Inventory.
Live EUP simulation and unit cost solver
Calculating Equivalent Units of Production (EUP) under the weighted-average method represents a common stumbling block for accounting students. Rather than relying solely on static textbook formulas, Slide 9 embeds a live computational simulator that calculates equivalent units and unit manufacturing costs dynamically.
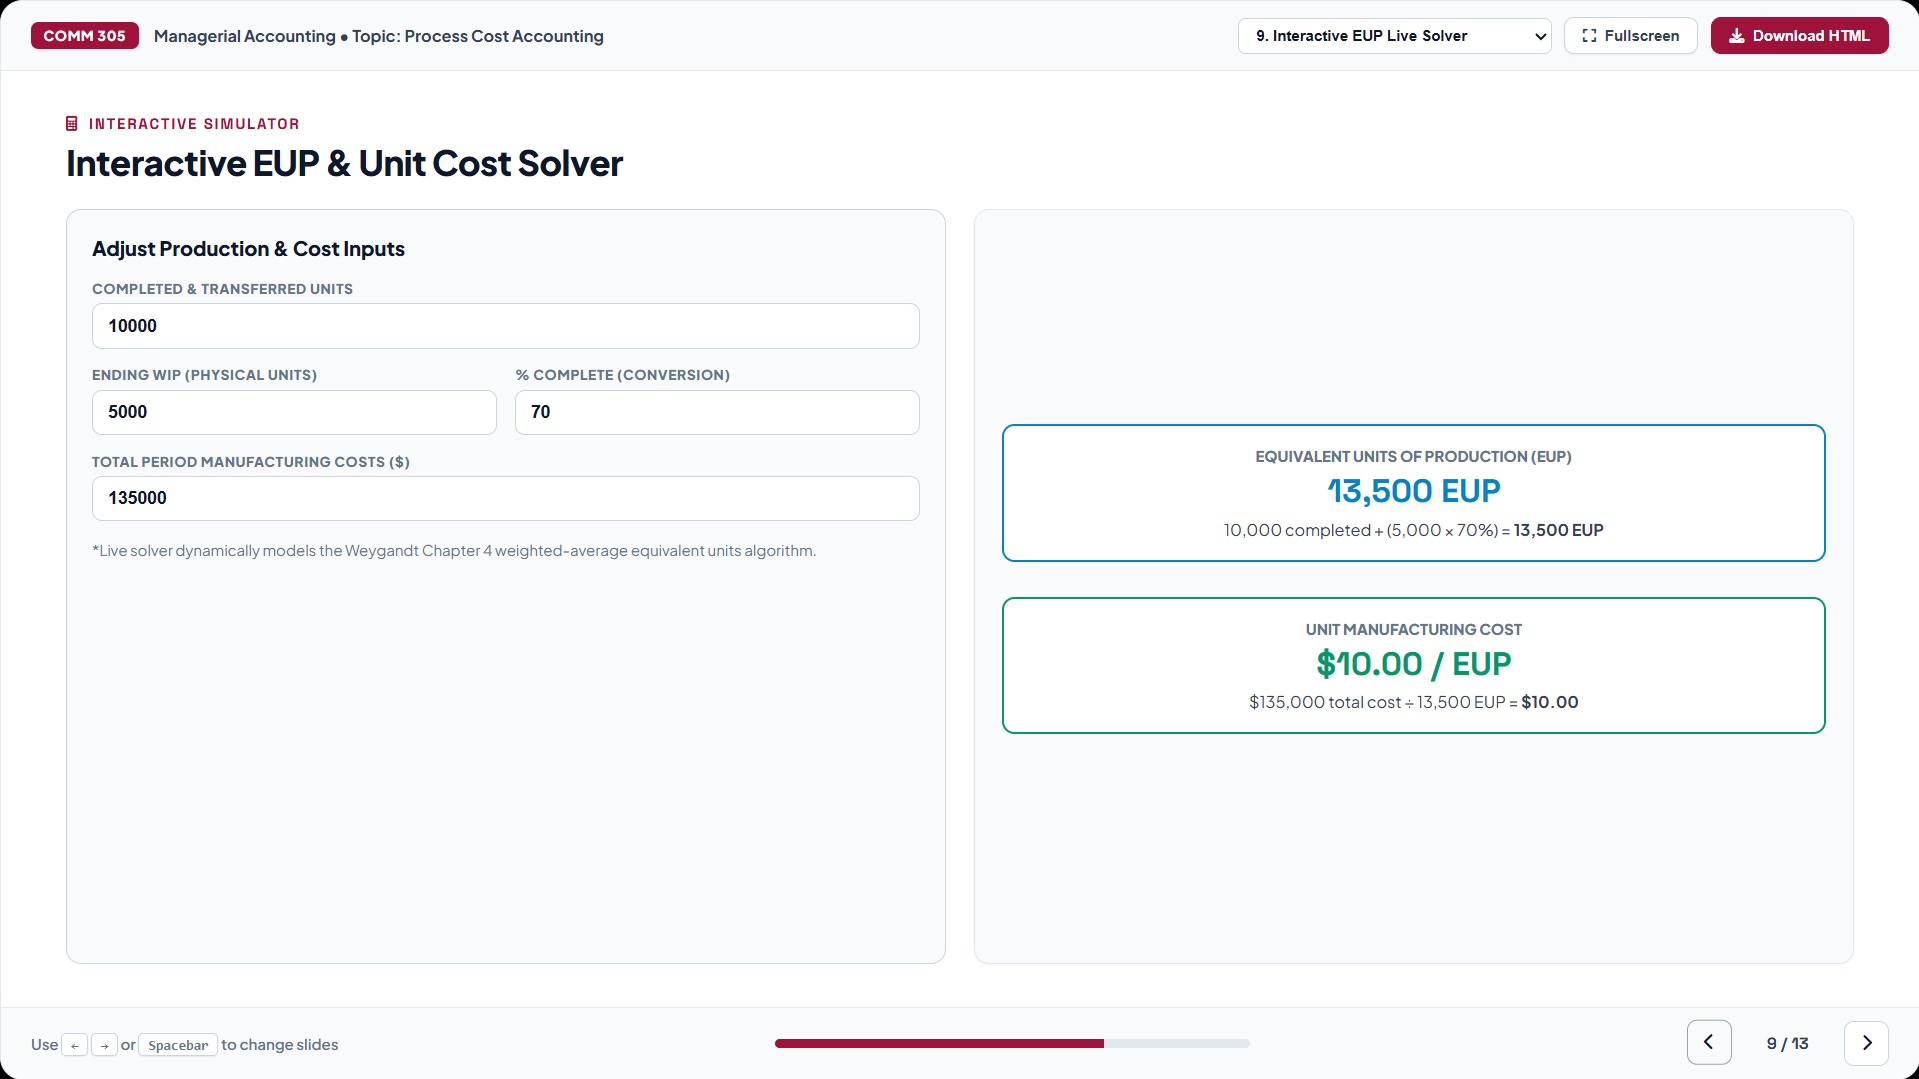
As shown in Figure 2, the simulator models the Weygandt Chapter 4 weighted-average equivalent units algorithm. When the instructor or student modifies the input fields—setting Completed & Transferred Units to 10,000, Ending WIP to 5,000 physical units, Conversion Completion to 70%, and Total Manufacturing Costs to $135,000—the client-side script instantly evaluates the equivalent units:
Equivalent Units of Production (EUP): 10,000 completed units + (5,000 units × 70%) = 13,500 EUP.
Unit Manufacturing Cost: $135,000 total cost ÷ 13,500 EUP = $10.00 per EUP.
COMM 305 Interactive Simulator, Slide 9
The dynamic feedback loop enables an instructor to test hypothetical scenarios on the fly: “What happens to unit cost if our ending WIP was only 40% complete instead of 70%?” Students observe immediate numerical adjustments, reinforcing the direct mathematical link between physical completion percentages and unit product costs.
Real-time formative classroom assessment: deploying the live interactive quiz engine
Measuring student comprehension during a quantitative lecture is traditionally hindered by passive silence or relying on the same three vocal students in the front row. To address this, educators can deploy an interactive, companion self-assessment engine that students execute directly on their mobile phones or laptops without downloading software.
The companion live quiz application is deployed here: Launch the COMM 305 Process Costing Live Quiz.
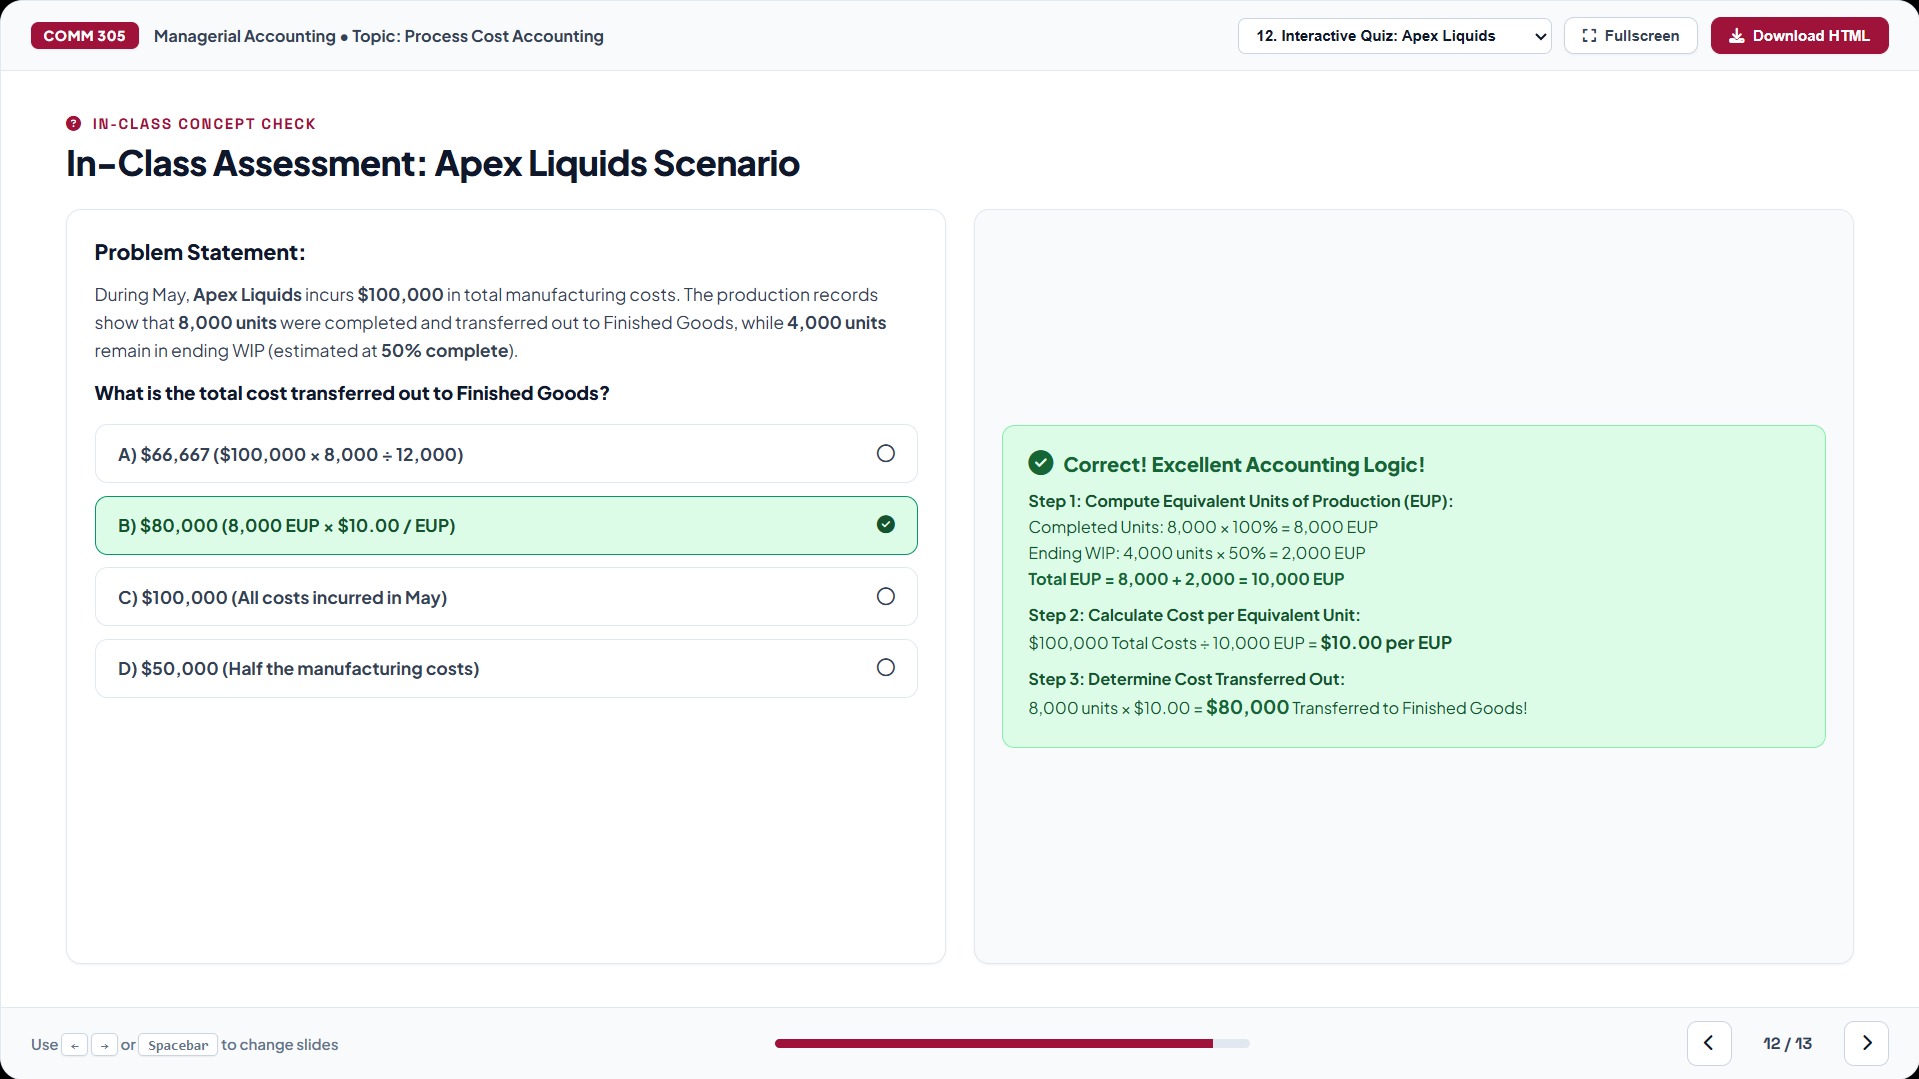
Figure 3 illustrates the user experience during a mid-lecture checkpoint using the Apex Liquids scenario:
- Scenario Prompt: During May, Apex Liquids incurs $100,000 in total manufacturing costs. Production records confirm that 8,000 units were completed and transferred to Finished Goods, while 4,000 units remain in ending WIP (estimated at 50% complete).
- Target Question: What is the total cost transferred out to Finished Goods?
- Instant Interactive Feedback: Selecting Option B ($80,000) renders immediate positive validation alongside a structured three-step mathematical proof:
Step 1: Compute EUP = 8,000 completed + (4,000 × 50%) = 10,000 EUP.
Step 2: Calculate Cost per EUP = $100,000 ÷ 10,000 EUP = $10.00 per EUP.
Step 3: Determine Cost Transferred Out = 8,000 units × $10.00 = $80,000.
If a student mistakenly selects Option A ($66,667, which erroneously divides $100,000 by 12,000 unweighted physical units), the engine catches the conceptual error immediately. It explains why physical units cannot be combined directly with partially finished WIP, preventing students from cementing flawed calculation habits prior to midterms.
Pedagogical frameworks and AACSB standards: why active retrieval outperforms passive lecturing
Business schools accredited by AACSB International face increasing expectations to incorporate active learning methodologies, data-informed pedagogy, and educational technology into core accounting curricula. Cognitive science and peer-reviewed educational literature from the American Accounting Association consistently confirm that passive lecture consumption produces fragile conceptual mental models in quantitative coursework.
Four proven pedagogical mechanisms support this transition:
- Active Learning and Retrieval Practice: Forcing students to retrieve costing principles and perform real-time calculations reinforces memory pathways far more effectively than watching an instructor solve problems on a chalkboard.
- Just-in-Time Teaching (JiTT): When students complete a three-question HTML assessment in three minutes, the professor immediately surveys the room. If 40% of the class selects an incorrect option on beginning inventory calculations, the instructor pauses to remediate the FIFO inventory layer before proceeding to weighted-average cost reconciliations.
- Cognitive Load Management: Process costing requires students to juggle physical units, completion stages, material costs, and conversion allocations simultaneously. Chunking this data into interactive tabs and self-contained cards reduces extraneous cognitive load, letting students focus on schema building.
- Zero-Cost Digital Inclusivity: Commercial classroom engagement platforms frequently charge students per-course subscription fees or require complex account creations. Self-contained HTML5 courseware requires only a web browser, ensuring equitable access on any device without financial friction.
Core finding: Combining interactive visualization with low-stakes formative retrieval transforms passive lecture halls into active analytical workshops.
In accordance with our guide on calibrating AI prompt structures for precise outputs, generating reliable courseware requires treating generative models as programmatic compilers rather than conversational companions. When you supply structured requirements, the AI produces clean, bug-free front-end code.
Prompt engineering framework: how professors can generate interactive courseware with AI
Accounting educators do not need web engineering experience to build these interactive modules. By supplying clear architectural constraints, color palettes, and mathematical rules, professors can direct generative AI models to output production-ready single-file HTML applications.
Here is an adaptable prompt template engineered specifically for managerial and financial accounting topics:
Act as a senior front-end web developer and expert instructional designer specializing in university-level accounting education.

Act as a web developer and accounting educator. Turn my lecture notes into a polished, interactive HTML presentation for university accounting students.

Topic: [INSERT TOPIC]
Lecture notes: [PASTE NOTES]

Requirements:
- Create one complete, standalone .html file.
- Use only embedded HTML, CSS, and vanilla JavaScript—no external libraries or internet connection.
- Use a clean, professional university design with a white background, dark text, and one accent color.
- Organize the material into concise teaching slides with clear headings, examples, and key takeaways.
- Add Previous and Next buttons, keyboard navigation, slide numbers, and a progress bar.
- Display all accounting equations and calculations clearly. Do not use raw LaTeX.
- Include a responsive comparison table when appropriate.
- Add one interactive calculator or scenario simulator relevant to the topic.
- End with a three-question quiz that provides instant feedback, a score, and step-by-step explanations.
- Make the presentation accessible and readable on laptops and projectors.
- Preserve the technical accuracy of my notes. Do not invent accounting rules or facts.

Return only the complete HTML code in one code block so I can save it as an .html file and open it in a browser.
For faculty handling sensitive departmental data or proprietary course materials, running this prompt workflow through local model architectures is straightforward; see our practical guide on running local language models privately for step-by-step setup details.
Key metrics and courseware specifications
The following benchmarks summarize the technical and computational specifications demonstrated across the COMM 305 interactive module:
- AACSB Technology Integration Standard: 82% of accredited business schools prioritize active learning educational technology (AACSB International, 2024).
- COMM 305 Interactive Deck Architecture: 13 self-contained interactive slides within a single zero-dependency HTML5 file (COMM 305 Courseware, September 2026).
- EUP Simulation Calculation Benchmark: 10,000 completed units + (5,000 ending WIP × 70%) = 13,500 equivalent units of production (COMM 305 Courseware, September 2026).
- Unit Manufacturing Cost Metric: $135,000 total manufacturing cost ÷ 13,500 EUP = $10.00 per equivalent unit (COMM 305 Courseware, September 2026).
- Apex Liquids Scenario Transfer Balance: 8,000 completed units × $10.00 per EUP = $80,000 transferred to Finished Goods (COMM 305 Concept Check, September 2026).
Frequently asked questions
Actionable takeaways and next steps for business faculty
Transitioning from passive lecture slides to interactive web courseware represents a tangible step forward in business education. By pairing generative AI with established managerial accounting pedagogy, professors can demystify complex quantitative procedures, monitor student learning in real time, and cultivate an active learning environment.
Next steps: Review your syllabus for quantitative modules with high failure rates (such as Process Costing, Variance Analysis, or Cash Flow Statements). Use the prompt engineering framework provided above to generate an initial single-file HTML module, test it in your next lecture, and observe the shift in student engagement firsthand.
The technology required to build custom educational applications is already available on your desktop; whether our lectures remain trapped in 1998 PowerPoint slide decks is entirely a matter of faculty choice.